1. Which of the following statements is/are incorrect?
2. Figure 2.1.G shows the pie chart representation of the weightage distribution of 5 different subjects in an exam. Based on this information, answer questions (2) and (3).
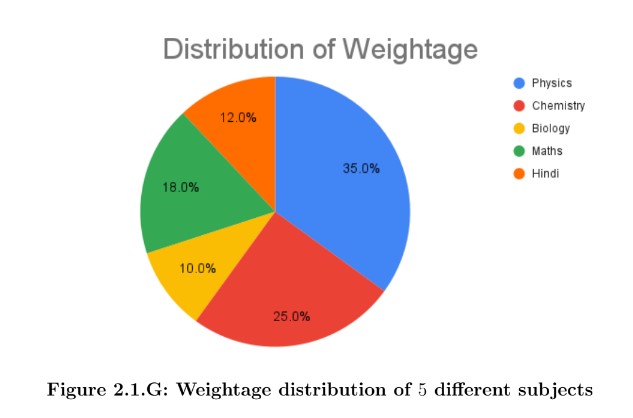
3. Choose the correct statement(s):
Table 2.1.G represents the distribution of 200 cricket players trained by different cricket academies in Chennai.
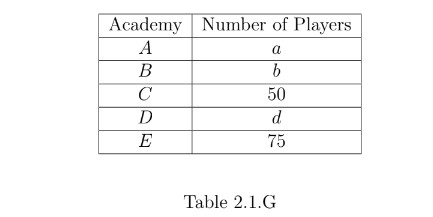
If each academy has trained at least one player, then based on the given information, answer questions (4), (5), (6) and (7).
5. Median of the given data is:
6. Mode of the given data is:
7. Which of the following graphical representations is appropriate for the number of players in each academy for the given data in Table 2.1.G?
8. The data of number of students sharing the same rank is collected. Which of the following is/are suitable to represent the collected data?
9. Choose the correct statement about categorical data:
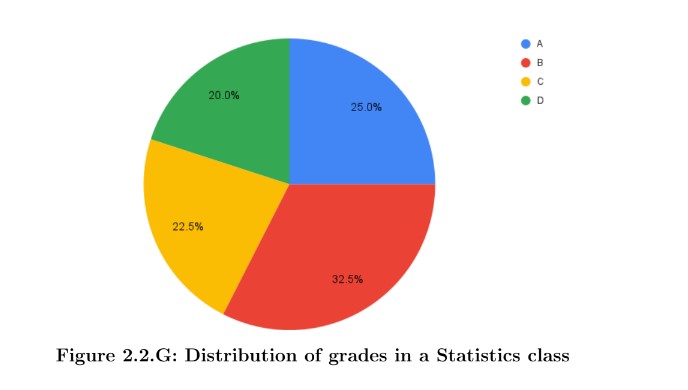
The distribution of grades in a Statistics class consisting of 80 students is shown by a pie chart in Figure 2.2.G. Based on the information given, answer the questions (10) and (11)
10. How many students have secured B grade?
26
11. What is the ratio of the students who secured a C grade to the students who secured an A grade?
0.9
Your point of view caught my eye and was very interesting. Thanks. I have a question for you.
Your point of view caught my eye and was very interesting. Thanks. I have a question for you.
Good
Somebody essentially assist to make severely
articles I’d state. That is the first time I frequented your website page and up to now?
I amazed with the research you made to create this particular publish incredible.
Wonderful activity!
What’s up, yes this post is truly fastidious and I have learned lot of things from it on the topic of blogging.
thanks.
Your article helped me a lot, is there any more related content? Thanks!
My partner and I stumbled over here from a different web page and thought I may as well check things out.
I like what I see so now i’m following you. Look forward to looking into your web
page yet again.
Thanks for finally talking about > Statistics Week 2 Graded Assignments IIT Madras < Liked it!